|
Ruthger Righart The COVID-19 pandemic has led to a lot of exceptional data visualizations from data scientists around the world. The goal of the current notebook is to provide a simple Python code that allows to make flat visualizations. It displays confirmed cases, recovery and fatality across different countries, corrected for population size and land area. The data are updated on daily basis. An interactive dashboard can be found here. Package versions used: numpy==1.18.1, pandas==1.0.1, matplotlib==3.1.3, and seaborn==0.10.0. A Docker container to run the code was created at GitHub. The original notebook file can be found here. Code Editor
The following function allows to load, process, and visualize the COVID-19 data. The data are loaded from 2 GitHub repositories. The function has the following parameters:
A country_list will be used to select the countries to be displayed. The function data_visualization allows to display the data, and easily check visualizations under different conditions. 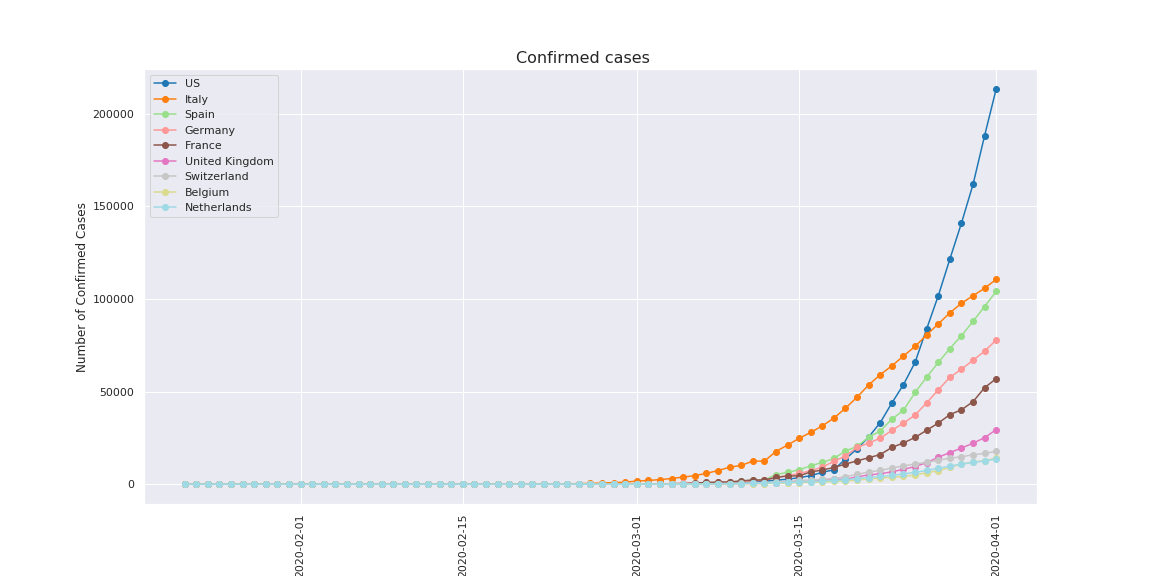 An interactive dashboard can be found at this site: 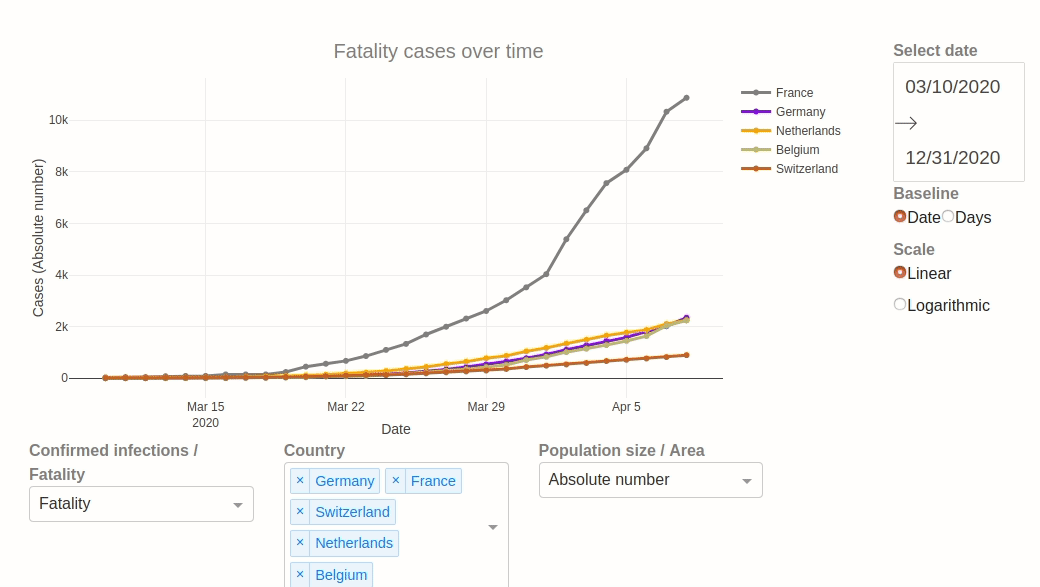 REFERENCES:
4 Comments
|


|
Ruthger Righart
Ferney-Voltaire France Email: rrighart at googlemail dot com Tel.: 0033 (0)770071310 Immatriculation au Registre du Commerce et des Sociétés: 833 982 358 R.C.S. Bourg-en-Bresse. Greffe du Tribunal de Commerce, 32 Av Alsace Lorraine, 01011 Bourg-en-Bresse Cedex. |