|
A dashboard can be a first step to important business or research insight. It is dynamic as charts can be automatically updated with the newest data. By combining different information sources it raises useful questions and supports decision making. The graphical user interface is intuitive and therefore the user does not need any programming experience.
It is not only for big data
Big data is a key theme in the era of data science. Though the value of big data is not denied, there is nothing in the quantity that guarantees success. The contrary: If used in a smart way, either small or big data can bring important insights. This all depends on data quality, cleaning, and not the least, how the data are visualized.
Start-up, small and medium sized enterprises may benefit from dashboards too
Is it only for the large enterprises? No. Start-up, small and medium sized enterprises have interesting data too. For some companies it can be a first step towards data insight. The implementation of dashboards is quick. It can give a first hint for interesting KPIs (key performance indicators) or other metrics such as sales, stock and forecasts. A dashboard is sometimes the best choice before a time- or cost sensitive investment is made, such as setting up a vast data architecture.
Go beyond spreadsheets
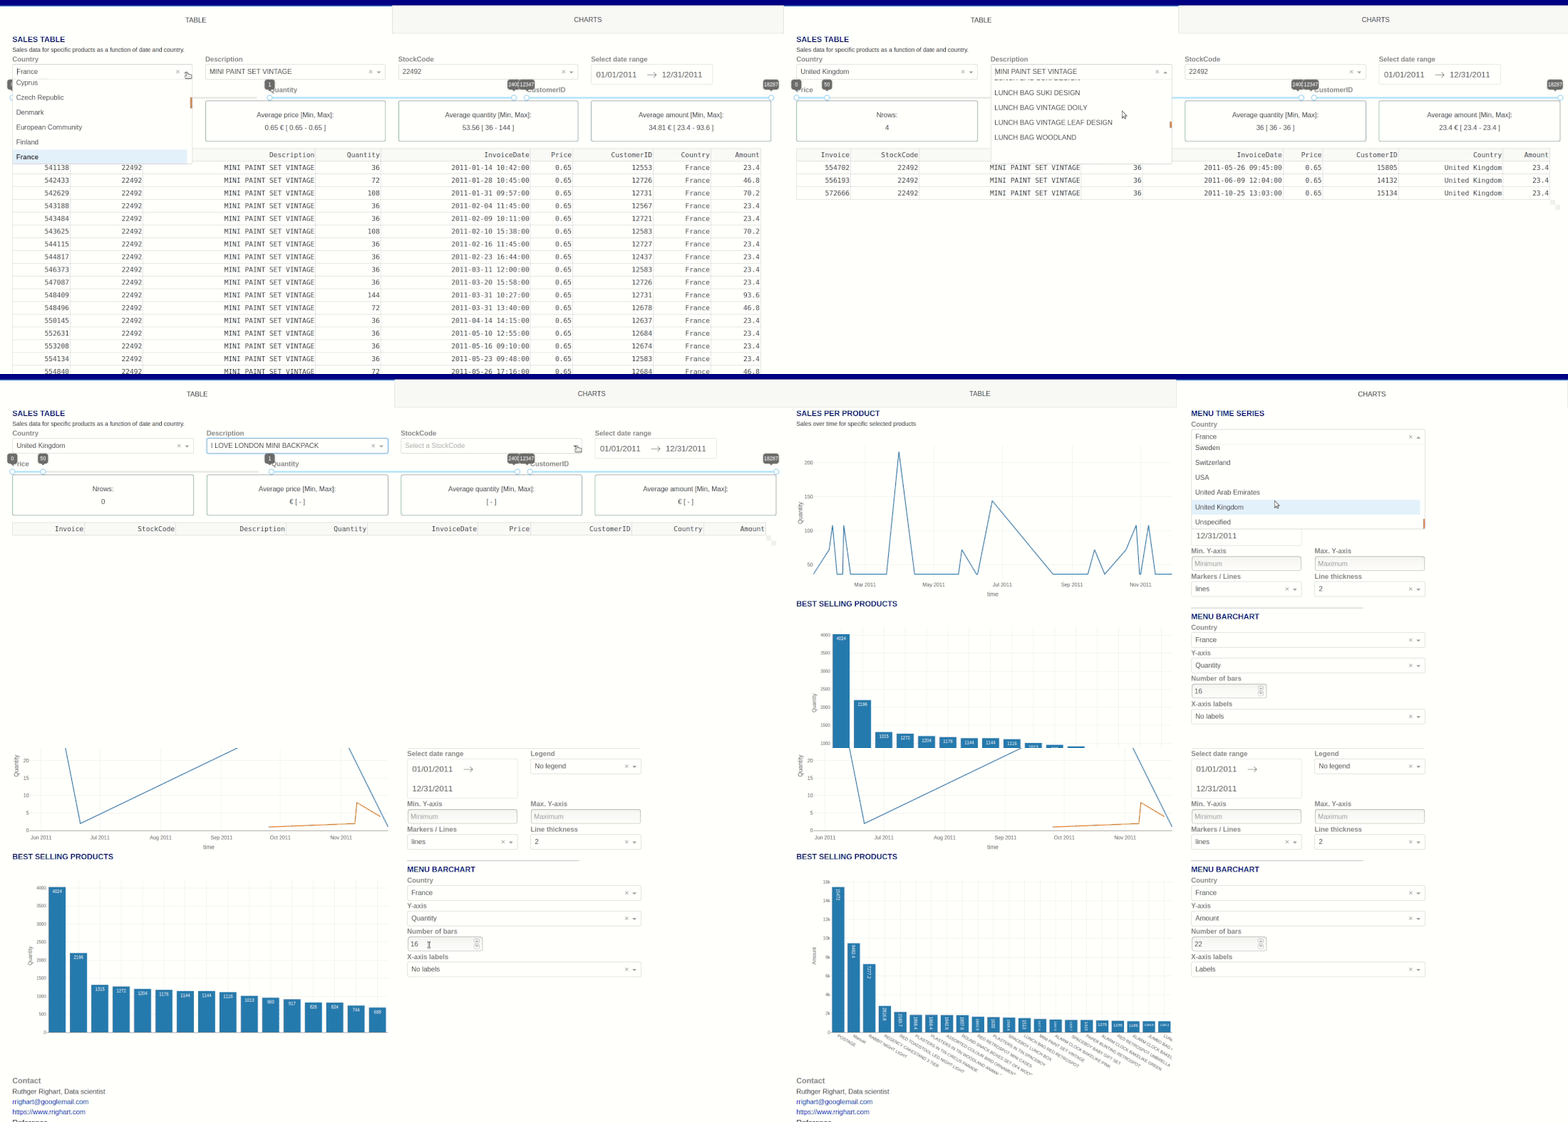
There is nothing wrong with a good spreadsheet. They serve as simple calculation tables, can summarize data with one button press, and finally various charts can be created. But the limits are felt when different dimensions need to be visualized, and this is not easy in a "flat" chart. Such dimensions can be displayed when a dashboard is used. See for example the dashboard demo. Imagine you want to monitor sales for different products, as a function of country. This is where a dashboard is very intuitive. Dashboard allow the user to view data interactively from all the different perspectives by user friendly graphic user interface (GUI), such as dropdown menus, sliders, buttons etc.
Merge various data sources in a single dashboard
Different aspects of a business can be brought together in a dashboard and show relationships that would otherwise escape attention. This is done by putting the right dimensions together and using a wide variety of tables and charts, such as barplots, lineplots, scatter diagrams, geolocalisation. For example, imagine a company that has in one data source sales data, and in another webtraffic data. Inspecting the sales and webtraffic data together may reveal an interesting patterns of customer behavior. Such insights may be important for different business aspects, such as marketing sales strategy.
Monitor if something is going wrong
In addition to strategic business information, a company needs alerts. To adapt business outcome in time, it is essential to act if any error occurs, or unexpected behavior of any kind.
This can for example be done by displaying time-series data such as streaming data. Streaming data is data that is generated continuously with a certain frequency. That is, new data flow in every second, minute, hour, or any other speed. Streaming data arise from a wide variety of measures, such as temperature, energy, sales, stock market, transport, internet of things (IoT). Data can be cleaned and processed "on the fly", and important parameters can be displayed instantly. Outliers can be spotted.
Predictive models can be integrated as well. A machine learning algorithm can display its predictions. For example, the demand for a product may change as a function of weather, season, and the location. Such demands can influence the supply chain. This information in itself can be visualized in a dashboard, but in parallel it can be used in an algorithm to forecast future demand. These forecasts can be shown in the same dashboard. Such dashboards can be customized and fine-tuned to the specific needs of a business.
Final thoughts
There is a wide variety of dashboard applications, each domain has its specific needs. Of course, it is always important to ask questions like: what kind of dashboard does my business need, is compatibility with available data stores required, should it be set-up in the cloud, which collaborators should be able to see the dashboard, is it only needed for a short-term project (presentation) or also for long-term decision making? These are just some of the possible questions. If you have any questions or remarks, please contact me at: [email protected]
Images on this site were kindly provided by https://unsplash.com/ .
2 Comments
Leave a Reply. |


